About LabDiagram
LabDiagram publishes labeled science figures you can read on screen, print and fill in: the periodic table, blank diagrams for students, reference tables and calculators such as molar mass and molarity. Every figure is drawn by us, and every calculator shows the numbers behind its answer.
What is on the site
Each page works like a lab sheet: a title block with the subject, figure and units, then the figure itself, then the explanation. Printable versions are clean black and white, and blank versions leave the labels empty so students can fill them in.
Where the data comes from
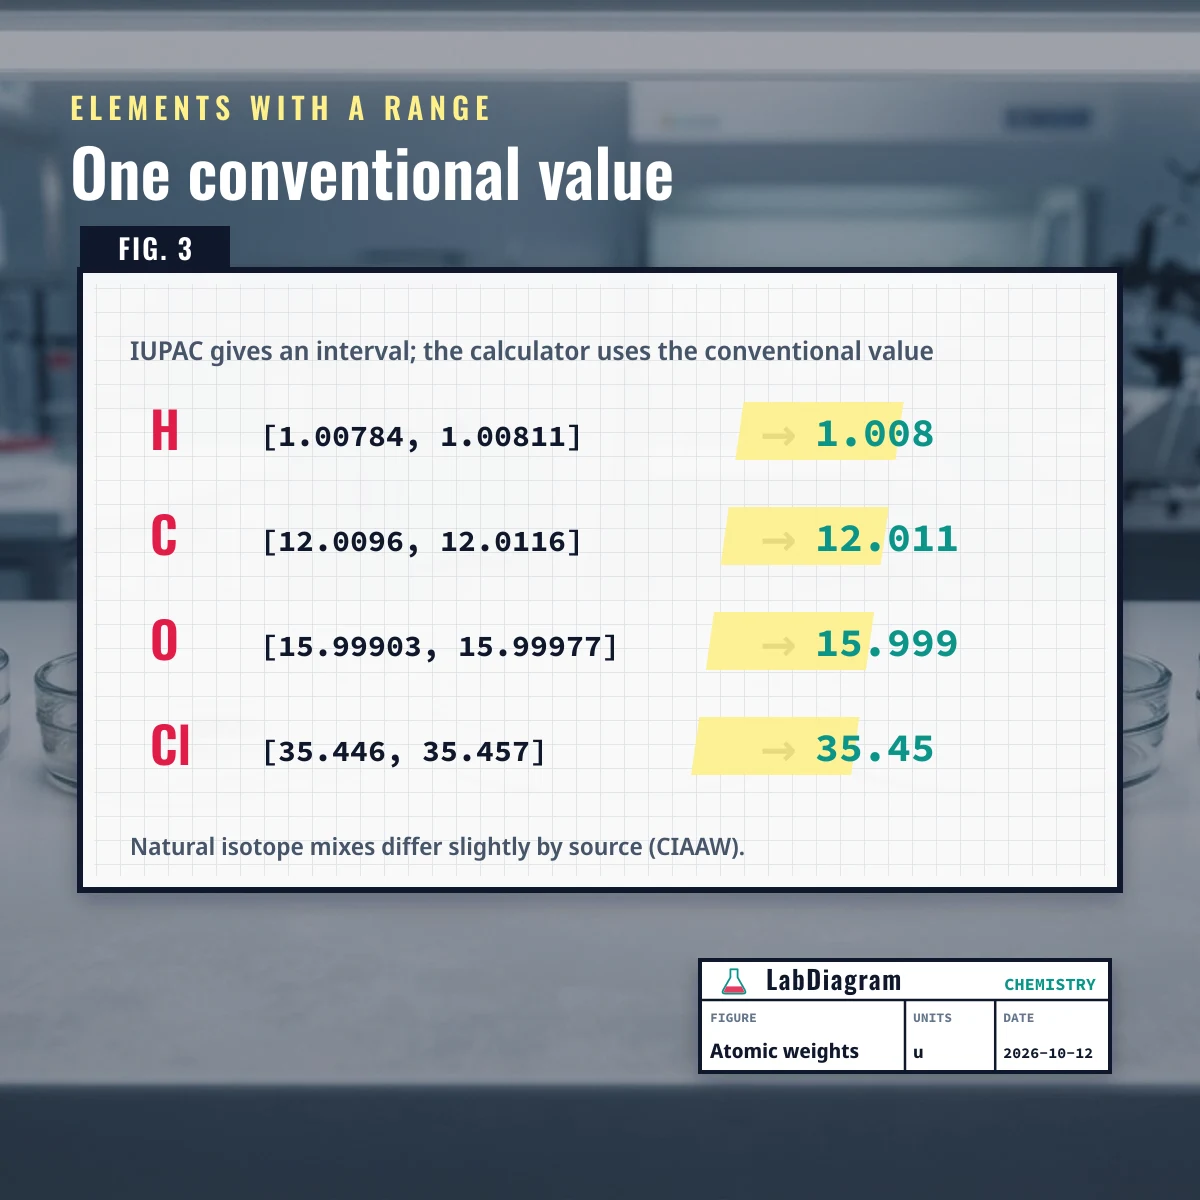
Atomic weights follow the IUPAC CIAAW standard atomic weights based on the 2021 report. For elements whose weight is given as an interval, such as hydrogen [1.00784, 1.00811] and chlorine [35.446, 35.457], the calculator uses the conventional single value (1.008 and 35.45). Elements with no stable isotope show the mass number of the longest-lived isotope in square brackets. Where a figure simplifies reality, such as a tidy phase diagram, the page says so.
What LabDiagram does not do
- It does not replace a textbook, teacher or safety data sheet.
- It gives no laboratory safety, medical or regulatory advice.
- It does not publish borrowed diagrams: the drawings are our own.
How the calculators were checked
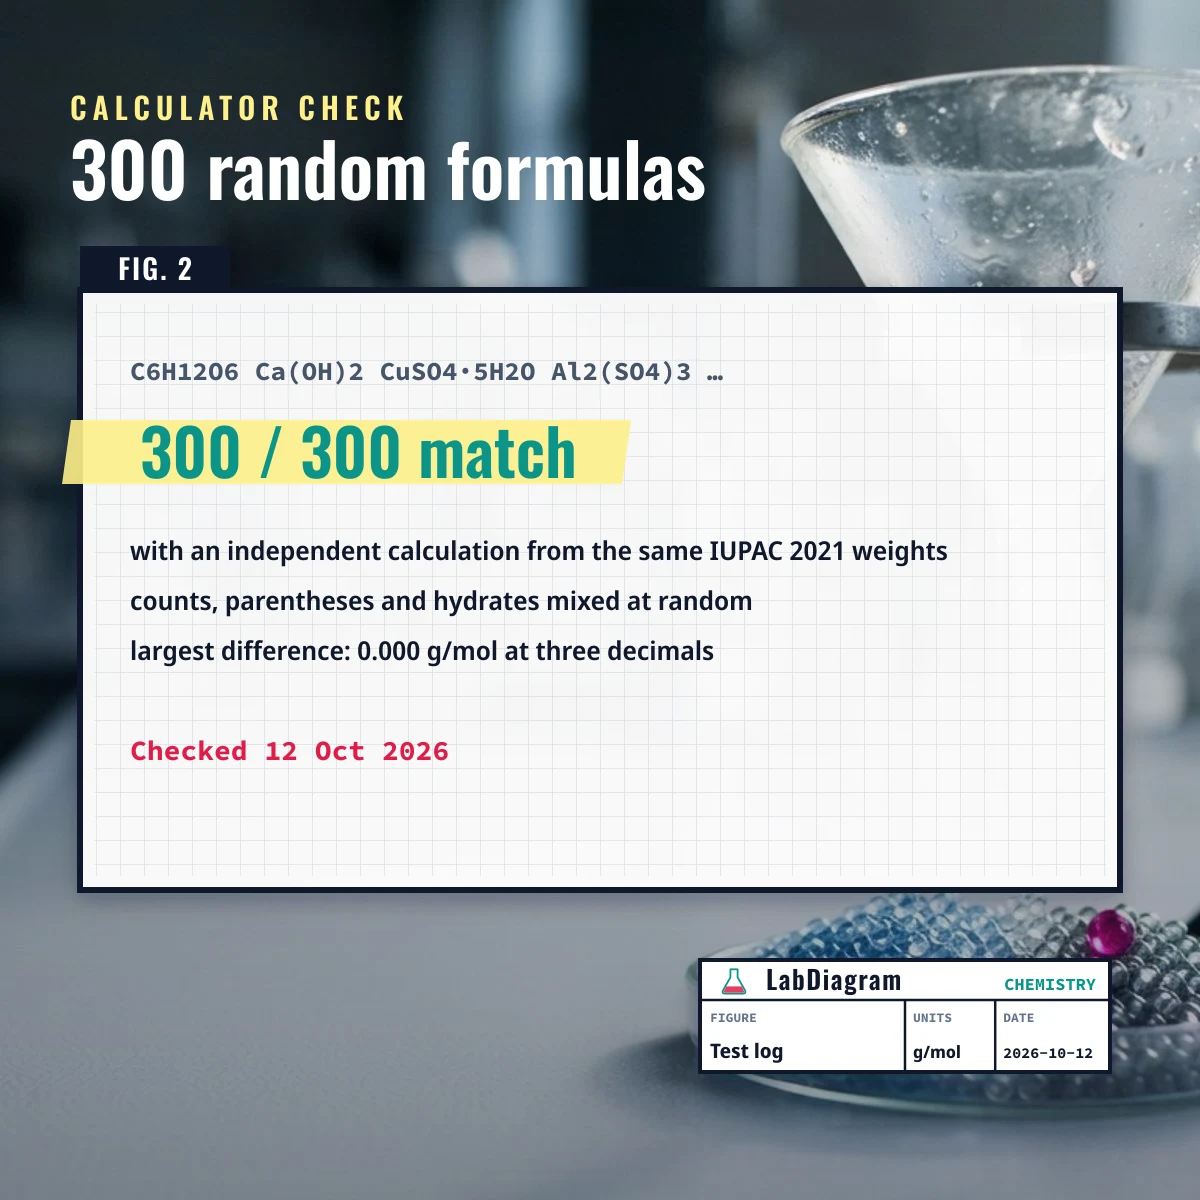
The LabDiagram team draws and writes each page. On 12 October 2026 we fed the molar mass calculator 300 random formulas, mixing element counts, parentheses such as Ca(OH)2 and hydrates such as CuSO4·5H2O, and compared each answer with an independent calculation from the same atomic weight table. All 300 matched at three decimals. We also compared 92 of the 118 element weights in the periodic table with the standard values, and every one agreed. The page date changes only when its content does.
Contact and privacy
Corrections and requests go to the address on the contact page. See the privacy policy for what is stored and the terms of use for the rules.
Frequently asked questions
Who creates the diagrams?
The LabDiagram editorial team. We reference published standards instead of claiming personal credentials.
Can teachers print the sheets?
Yes. Printing for classroom and home study is welcome.
Is it free?
Yes. There is no account, no fee and no ads at the moment.
Back to the Molecular Weight Calculators on the home page.